Resources
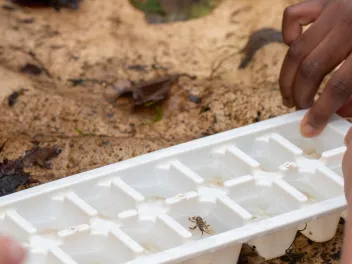
This infographic explains biomonitoring, which is using aquatic (benthic) organisms as biological indicators of water quality.
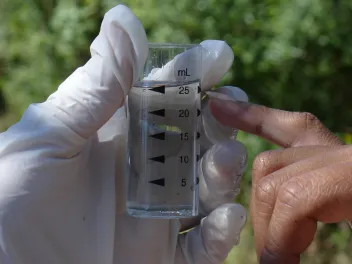
This infographic highlights some of the common water quality indicators, why they are important, and how we measure them.
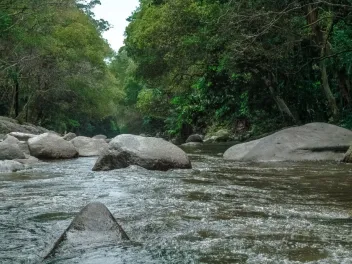
This infographic shows how rainwater and melting snow contribute to watersheds, explains watershed characteristics in detail, and shows why watersheds are so…
This infographic explores the many applications of mathematical principles and formulas within the fields of environmental science, technology, and engineering…

Get an overview of Teens and Their Futures from the 2016 NEEF Teen Benchmark Survey with this fact sheet.
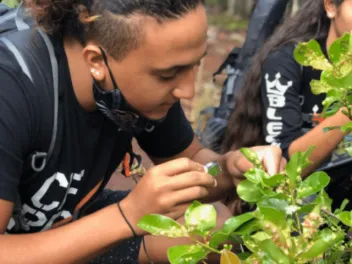
Use this infographic to learn about the value of citizen science, as well as examples of opportunities to learn about the planet and the dynamic systems found…

Explore the past, present, and future of environmental engineering through this infographic.

This infographic illustrates some of the many ways STEM and environmental knowledge are becoming increasingly more important to US businesses and career paths.

NEEF created this infographic to help educators introduce students to some of the many ways they can discover more of the science going on around them, both…

NEEF's Children and Nature Infographic offers a visual display on how being active in nature can lead to improved health outcomes.