This summer has been a scorcher so far.
In June, a record-breaking “heat dome” lingered over the eastern and midwestern United States. This trend has continued throughout the summer, with many major metropolitan areas declaring heat advisories or excessive heat warnings with little relief in sight.
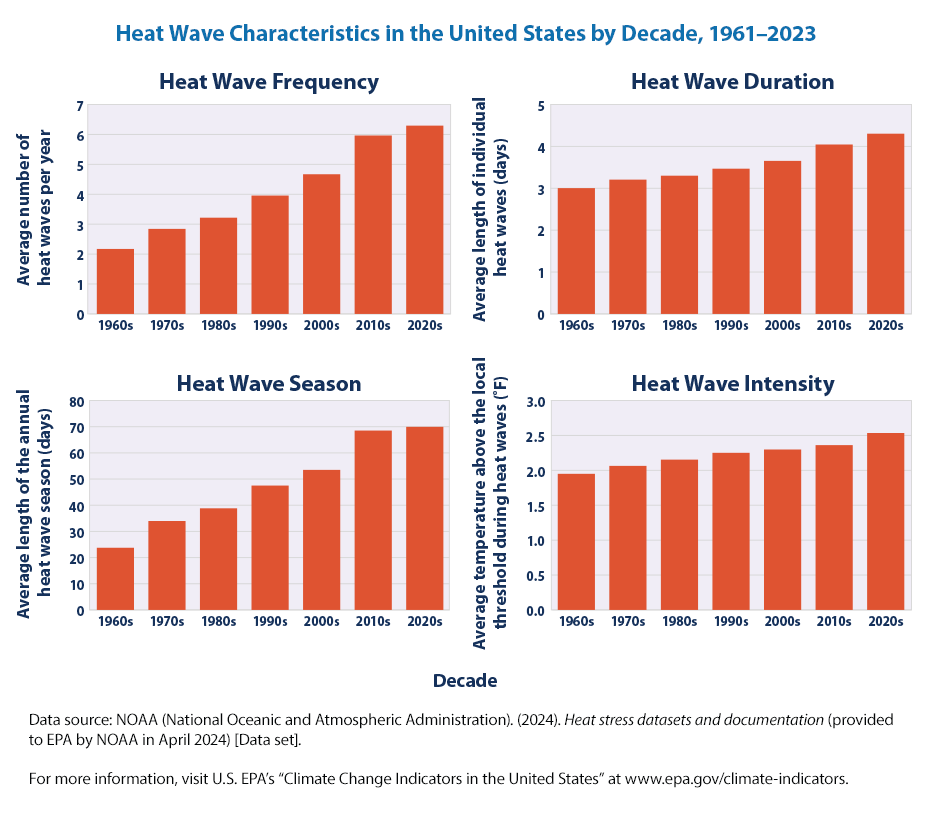
Over the past few decades, unusually hot summer days have become more common in the US. The length and frequency of heat waves has increased steadily over the past 60 years, from an average of two heat waves per year during the 1960s to six per year during the 2010s and 2020s, with the average heat wave season across 50 major cities now lasting a whopping 49 days longer on average.
As the number of extreme heat events in the United States continues to rise, climate projections indicate that these events will be more frequent and intense in the coming decades. According to the US Environmental Protection Agency (EPA), a changing climate is expected to produce increases in extreme temperatures worldwide.
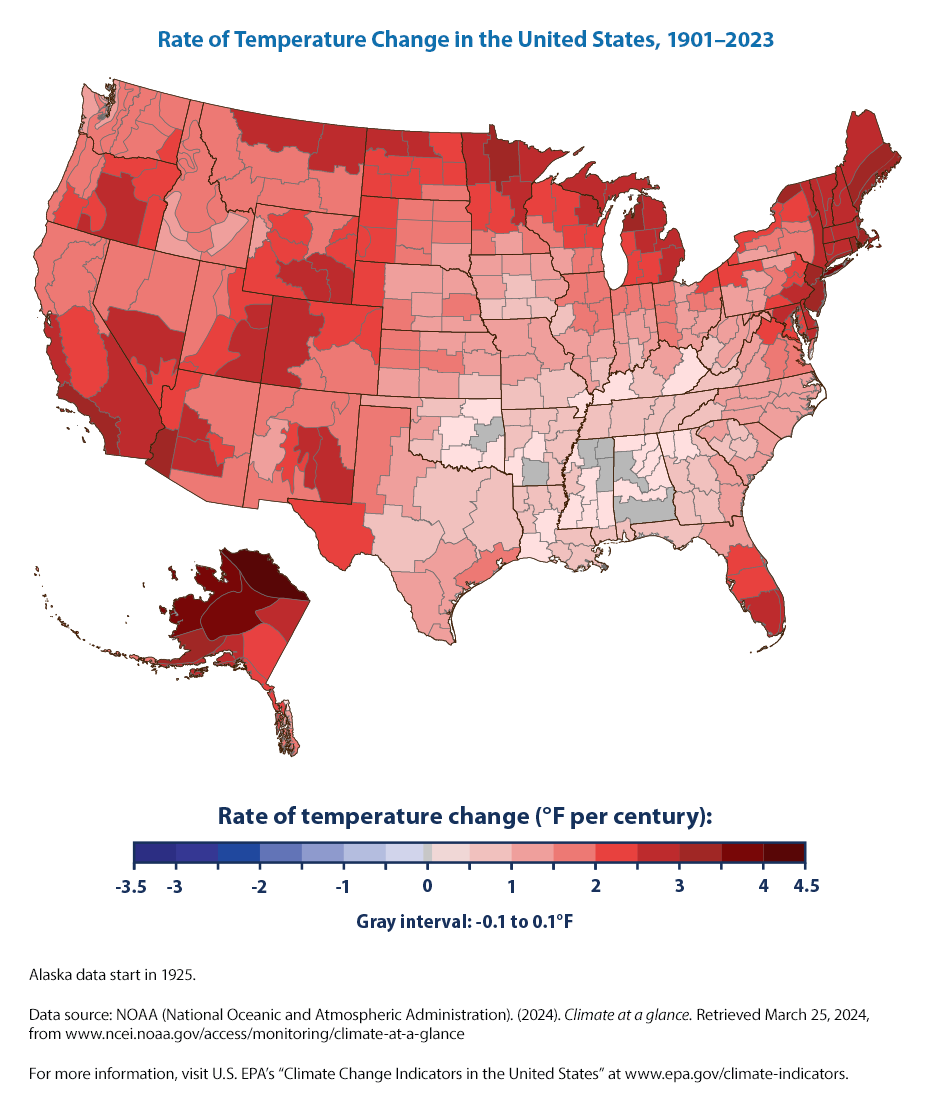
In the US, we’re already feeling those effects—nine of the 10 warmest years on record have occurred since 1998. However, as shown in the map below, some parts of the country are experiencing more warming than others.
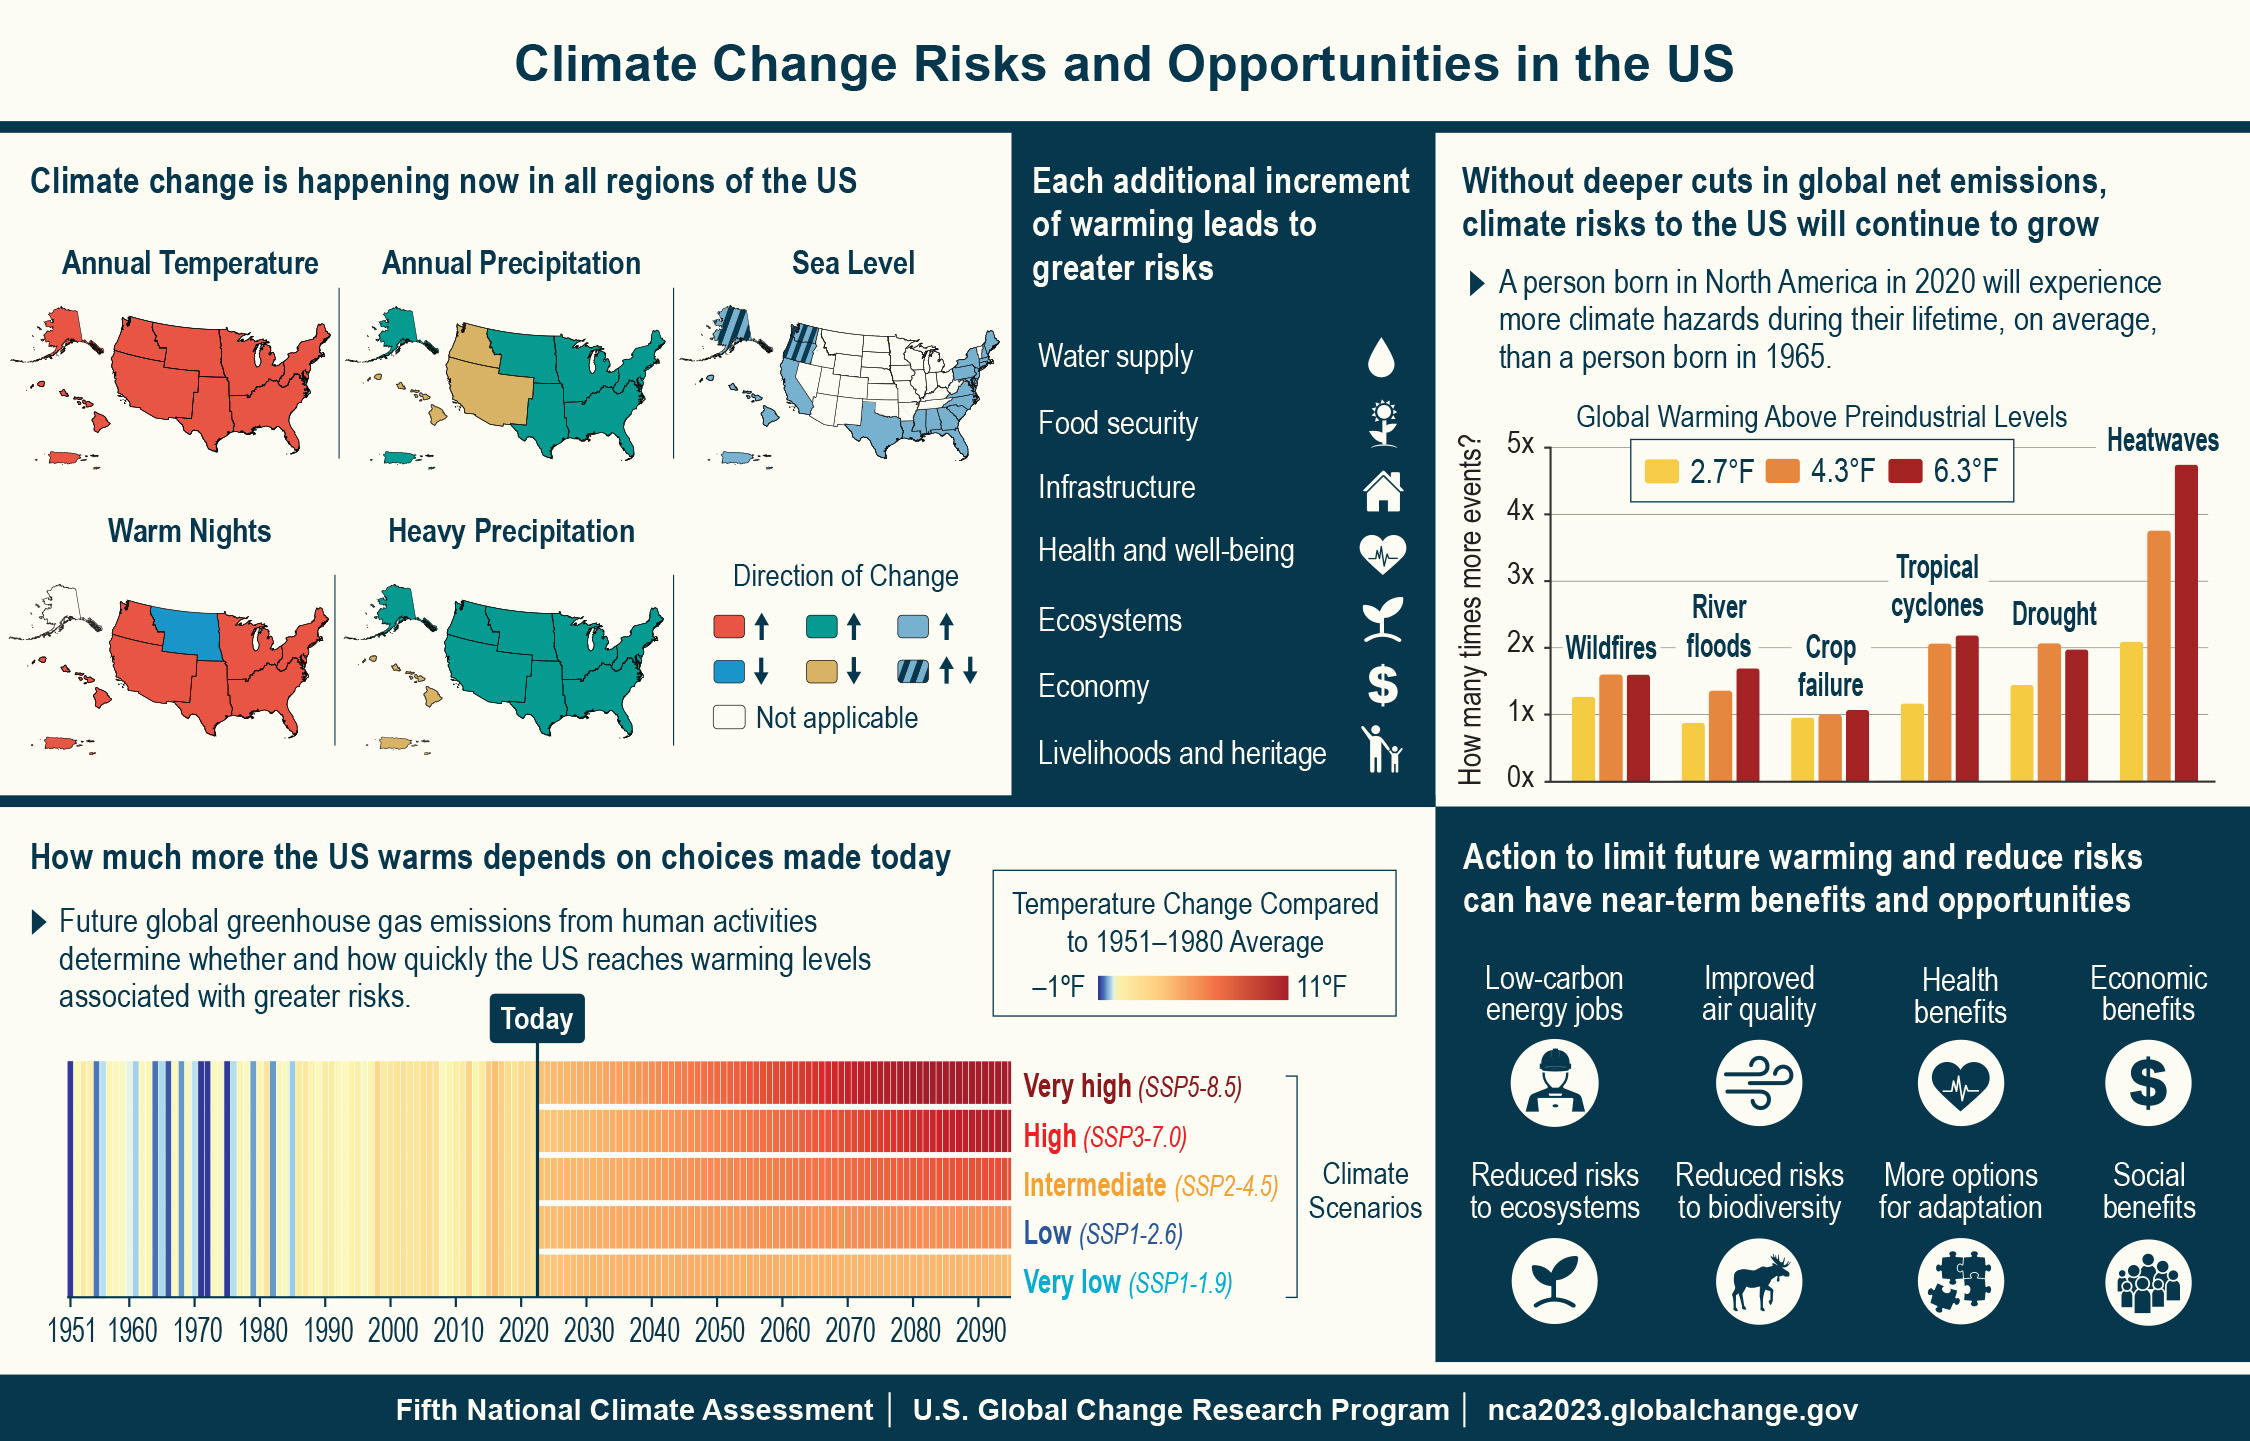
On average, people born in North America in 2020 will be exposed to more climate-related hazards compared to people born in 1965. The exact impacts will depend on the level of future warming, which is linked to the choices we make today. The faster and further the world cuts greenhouse gas emissions, the more future warming will be avoided, increasing the chances of limiting or avoiding harmful impacts.
How Extreme Heat Impacts Your Health
Extreme heat is a leading cause of weather-related deaths in the United States. But, it's important to remember that not everyone is equally at risk. Children, people 65 years and older, people who are sick, and people without access to air conditioning are at greater risk of heat-related illnesses. Heat-related deaths are often a result of heat stroke and related conditions, but also occur in people with cardiovascular disease, respiratory disease, and cerebrovascular disease.
When temperatures rise, many people head to the beach or pool to cool off. But fun in the sun can also bring health risks. Unprotected exposure to UV radiation from the sun is the most preventable risk factor for skin cancer. More people in the US are diagnosed with skin cancer each year than all other forms of cancer combined. Don’t skimp on applying that sunscreen!
How to Protect Your Health During Heat Waves
It’s important to know the difference between heat warnings, watches, advisories, and outlooks issued by the National Weather Service (NWS). An Excessive Heat Warning means that extremely dangerous heat conditions are underway, and you should take immediate action to stay safe. An Excessive Heat Watch indicates that an excessive heat event could begin in the next 24 to 72 hours—make sure you’re prepared!
Stay updated on current conditions using these online resources:
- NOAA Heat Index: Find out how hot it really feels when relative humidity is factored into the actual air temperature.
- NWS HeatRisk Map: View the forecasted risk of heat-related impacts over a 24-hour period.
- OSHA Heat Safety Tool App: Calculate the heat index and get reminders about extreme heat safety for outdoor workers.
Stay safe during the next heat wave by following these tips:
- Slow down. Wait until it's cooler outside to do strenuous work, sports and exercise, or gardening.
- Stay cool. Look for shade outside and seek out air conditioning inside. If you don't have air conditioning, visit a senior center, movie theater, library, mall, or designated community cooling center.
- Drink up. Drink plenty of fluids, but avoid caffeine and alcohol as they can increase dehydration.
- Check on others. If you have a family member or neighbor who is at risk, visit them regularly. If you see signs of heat-related illness, seek medical help immediately.
- Apply sunscreen. Apply at least a golf ball-sized amount of SPF 30+ sunscreen to all exposed skin 15 minutes before going outside. Don’t forget to use sunscreen on areas that are easy to miss, like the top of your head, hands, feet, and lips. Access NEEF’s free environmental and health education program SunWise for more sun safety recommendations.
- Wear the right clothing. When spending time in sunny, hot climates, make sure to wear lightweight, loose, light-colored clothing to allow for maximum air circulation. And be sure to wear a wide-brimmed hat!
- Take a break. Seek shade when you can. The sun’s UV rays are strongest between 10 a.m. and 4 p.m.