What is Snowpack?
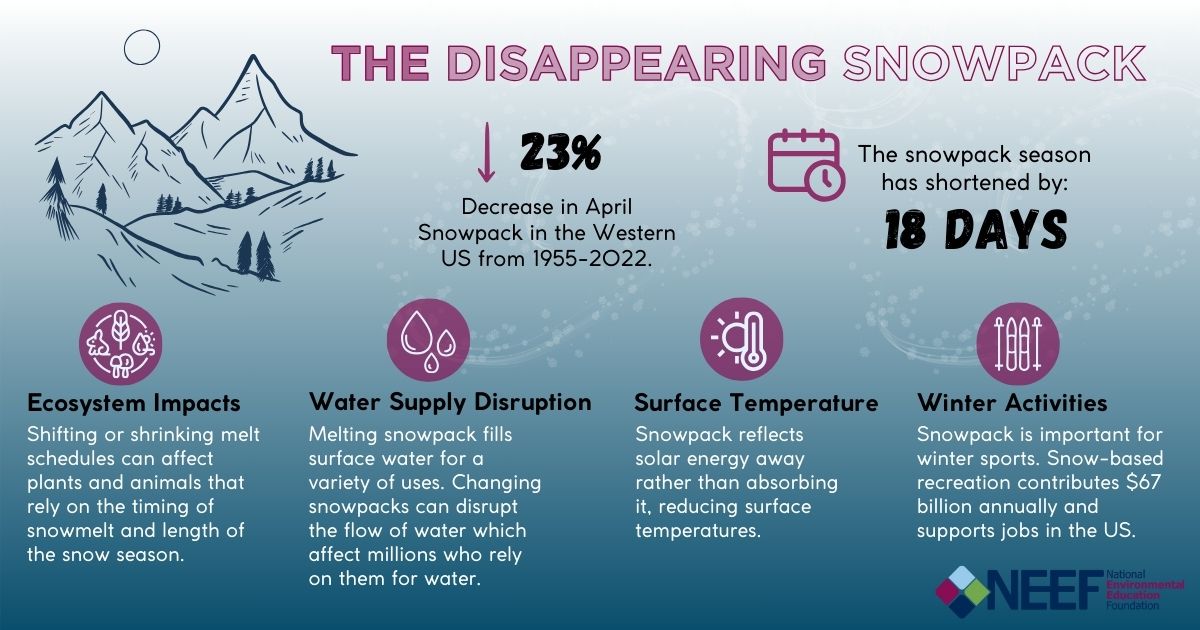
Snowpack is snow on the ground in mountainous areas that persists until the arrival of warmer seasons. About one-third of Earth’s land surface is covered by snow for at least some part of the year. Snowpack reflects solar energy away rather than absorbing it, reducing surface temperatures. It also plays a major role in the water cycle—in most western river basins, snowpack stores more water than human-constructed reservoirs.
However, our winters are changing. From 1955 to 2022, April snowpack in the western United States declined by about 23%, especially in Washington, Oregon, and northern California. The snowpack season has also shortened by about 18 days on average. A shorter snowy season brings other changes to ecosystems as well, such as earlier bud break for plants and a longer growing season.
Why is Snowpack Important?
In the winter, mountain snowpack is used for skiing and other snow-related recreational activities on public lands. This water source is even more useful in the spring and summer when it melts and releases water to sustain ecosystems, municipal and industrial water supplies, agriculture, and hydropower. Millions of people across western North America rely on the melting snowpack for drinking water and household water use.
As more precipitation falls as rain instead of snow in a warming climate, there is less snowpack available in the spring and summer. This increases the risk of drought, water scarcity, and large wildfires that negatively affects farmers, hydropower, drinking water, salmon and other animals, recreational activities, and people’s physical and mental health.
California’s Shifting Snowpack and Water Supply
In California and other arid states west of the Rockies, snowmelt provides a critical fresh water supply in the summer and fall, when rainfall is sparse. Years of drought have illustrated how California faces new climate changes.
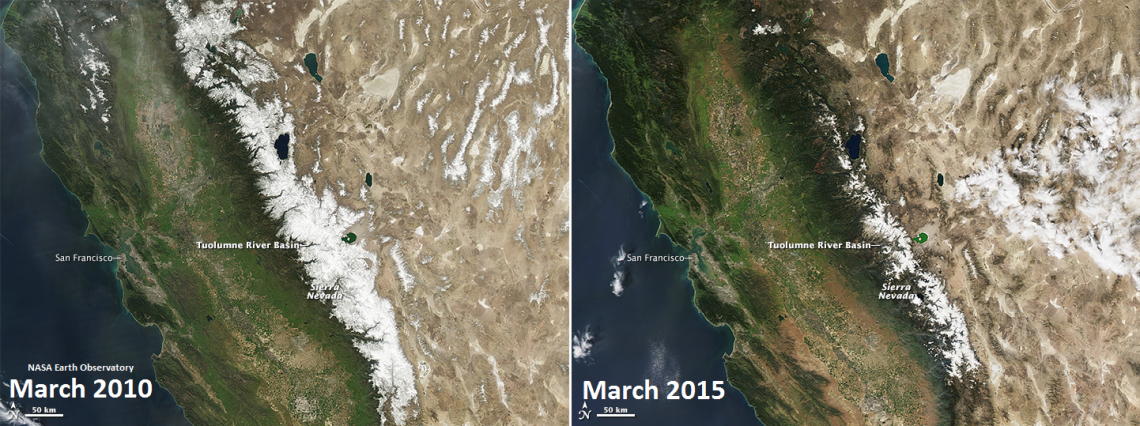
The image below shows reduced snowpack at the Tuolumne River Basin in the Sierra Nevada in March 2015 compared to March 2010. This river basin supplies water to San Francisco and neighboring communities. Reduced snowpack makes it even harder for California to meet its water demands in the summer and fall during periods of low precipitation and drought.
More recently, California has experienced the opposite extreme. After a year of severe storms and atmospheric rivers, electronic readings from 130 snow sensors placed throughout the state found that the statewide snowpack’s snow water equivalent in 2023 was 61.1 inches, or 237% of average. This was the highest recording since the snow sensor network was established in the 1980s.
California generated 94% more hydropower during the first six months of 2023 compared with the year prior. The US Energy Information Administration forecasted 99% more hydropower generation in California during 2023 compared with 2022.
While winter storms have recently helped the snowpack, reservoirs, and hydropower production, groundwater basins are much slower to recover. The size and distribution of this year’s snowpack also posed severe flood risk to parts of the state, especially the southern San Joaquin Valley, another example of the many complicated ways that climate change and extreme weather impacts communities and environmental health.
Like California, climate variability is expected to increase across the northwestern US, interspersing years of heavy precipitation and major flooding with periods of long drought.
The Snowpack Outlook for 2024 and Beyond
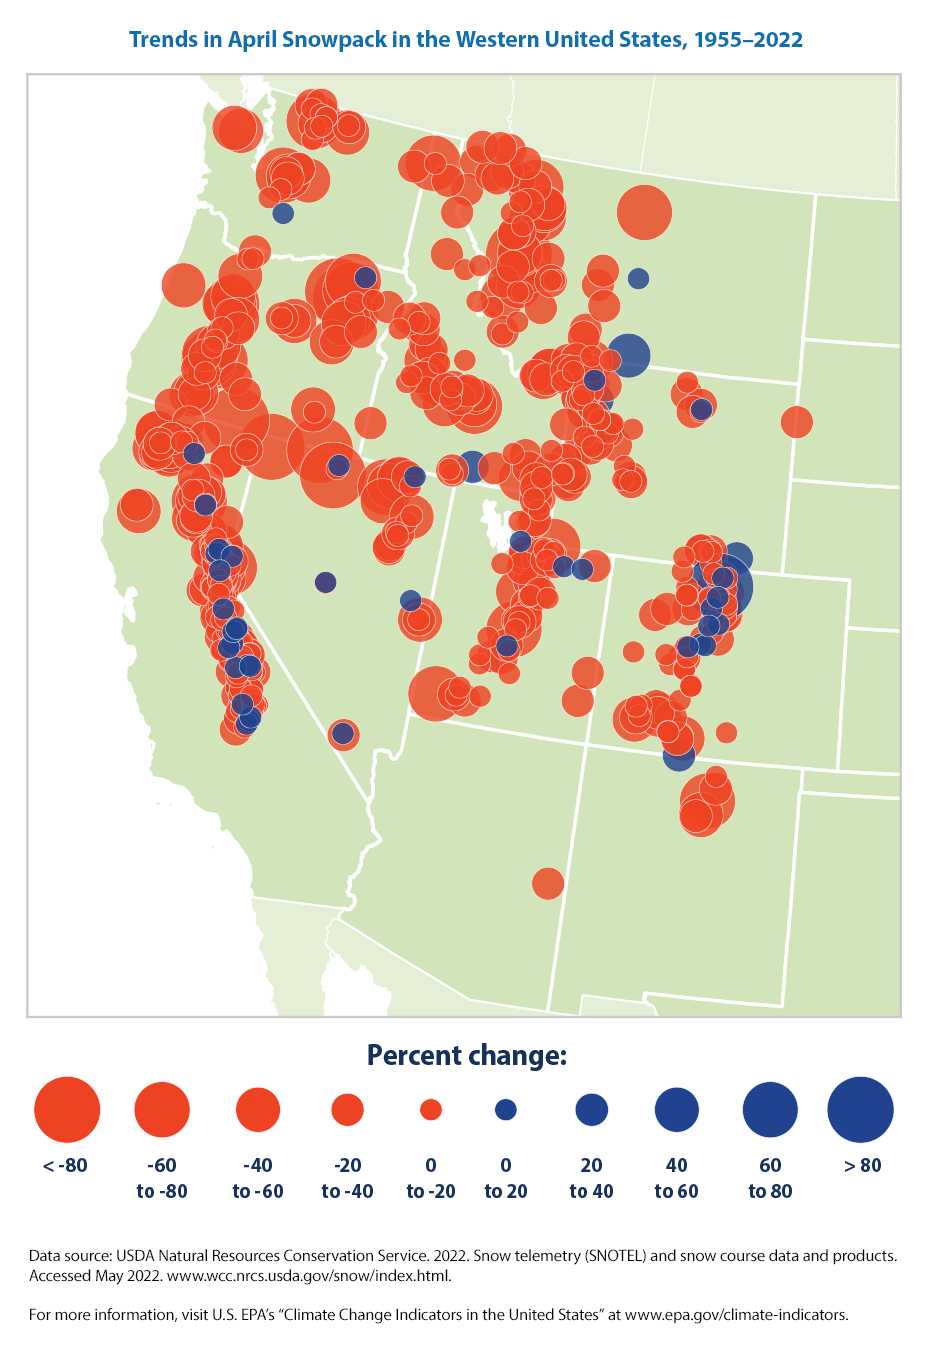
From 1955 to 2022, April snowpack in the western United States declined at 93% of the sites measured. The map below shows the trends in April snowpack in the western United States. Blue circles represent increased snowpack and red circles represent decreased snowpack.
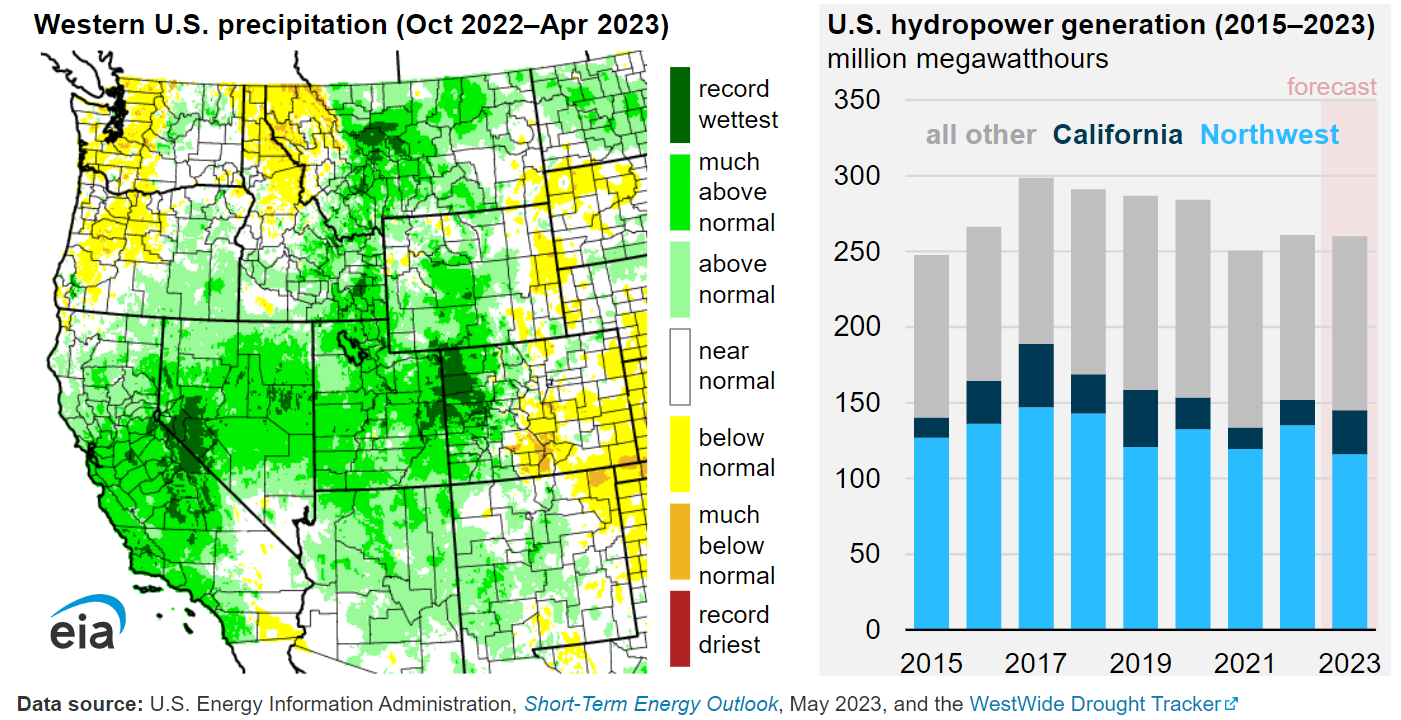
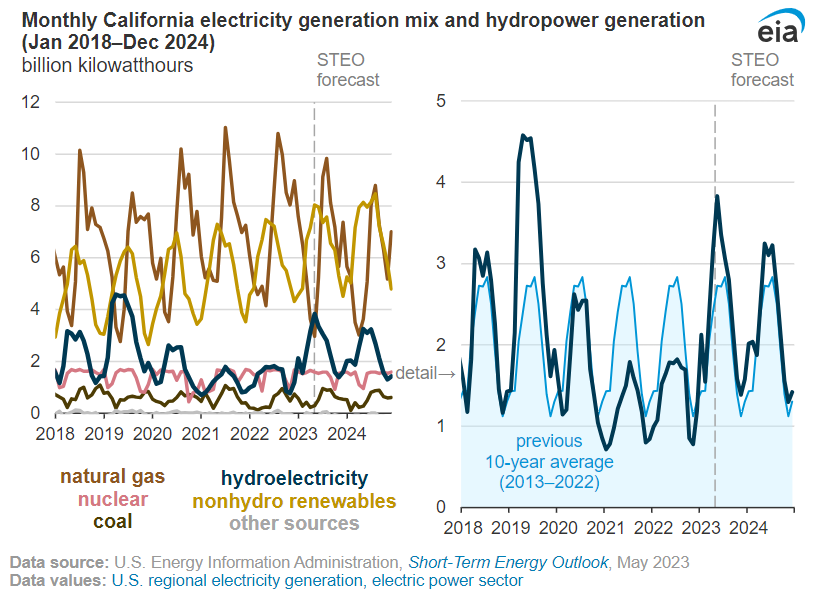
The graphs below show how the West’s water supply affects the outlook for hydropower generation and the overall energy supply. Record-breaking rain and snow during the 2022-2023 winter season increased the forecast for hydropower generation in California, while extreme heat waves and a dry summer in the Pacific Northwest with below-normal precipitation resulted in a mixed water supply and hydropower outlook.
The short-term energy outlook shows which parts of the US rely on hydropower the most.
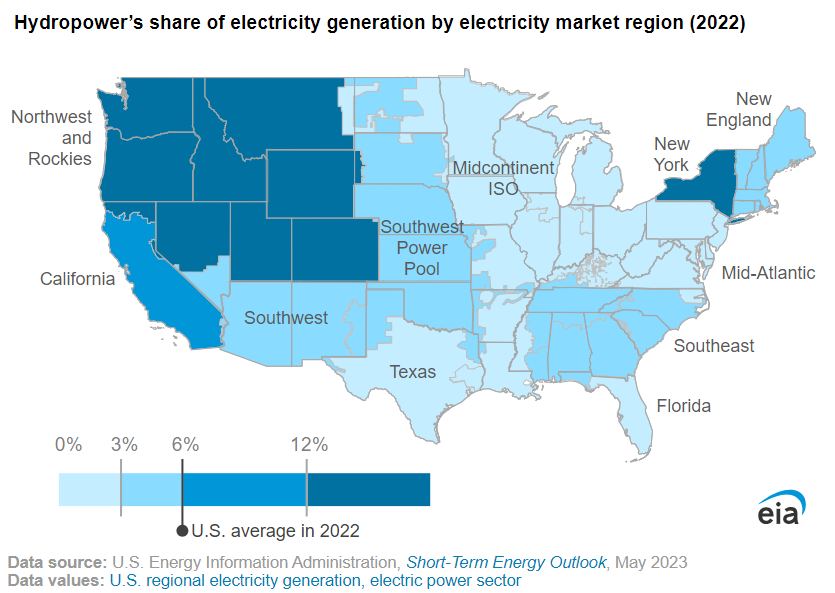
Due to California’s recent increased precipitation and snowpack, hydropower generation in the state was expected to increase in 2023 while electricity generation from other sources, such as natural gas, decreased.
What You Can Do
No matter where you live, you can take action to reduce your household water use and learn more about how climate change is impacting winter weather conditions on public lands in your area.
- Discover more about your household water use and how you can save water at home.
- Learn about drought and its impacts in NEEF's free online course, Dealing with Drought. The course uses the 2012-2016 California drought as a case study and draws on expertise from trusted sources including the US Environmental Protection Agency, the National Drought Mitigation Center, the US Forest Service, NASA, and NOAA.
- Warmer winters can bring environmental health impacts. Read NEEF’s climate change and health fact sheet to understand its direct and indirect effects.
- Download this infographic from NEEF to do your part to protect water quality in the ponds, streams, and rivers near where you live.
- Visit the USDA Forest Service’s StoryMap that illustrates how winters are changing in your area and the many impacts that a snow drought brings.