Resources
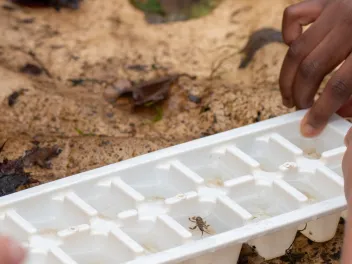
This infographic explains biomonitoring, which is using aquatic (benthic) organisms as biological indicators of water quality.
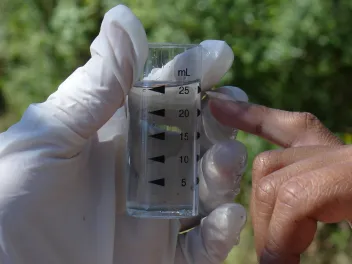
This infographic highlights some of the common water quality indicators, why they are important, and how we measure them.
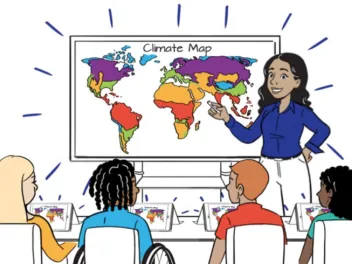
This Educator Guide offers resources to help educators incorporate Climate Superstars Challenge tasks into their lesson plans. The Guide contains supplemental…

Interested in the Spanish language SunWise Tool Kit but not sure what to expect? Check out the sample activities below. Activities include educator and student...
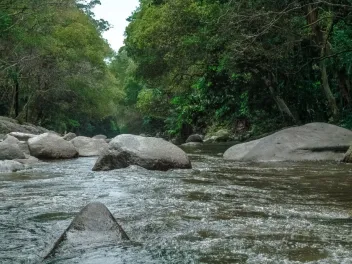
This infographic shows how rainwater and melting snow contribute to watersheds, explains watershed characteristics in detail, and shows why watersheds are so…

Based on currently available information and clinical expertise, people of any age who have serious underlying conditions might be at higher risk for severe…

International Paper and NEEF collaborated on sustainable hourly employee engagement strategies, aiming to create a model for community engagement in their US…
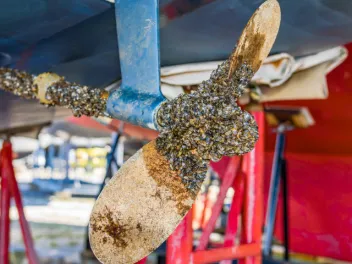
This infographic shows how you can stop the spread of invasive aquatic species.
This infographic explores the many applications of mathematical principles and formulas within the fields of environmental science, technology, and engineering…
Interested in the SunWise Toolkit but not sure what to expect? Check out the sample activities below, which include educator and student pages that guide both…